Reorder Point Calculator Excel: Never Stock Out | Shopify Inventory Guide
Stop guessing when to reorder inventory. Learn how to calculate scientifically accurate reorder points and order quantities in Excel using days of supply, lead time, and safety stock formulas.
The $50,000 Stockout That Could Have Been Prevented
Your bestselling product went out of stock on Monday. By the time new inventory arrived Thursday, you'd lost 127 orders. At $395 average order value, that's $50,165 in lost revenue. The worst part? You had sales data showing you'd hit reorder point two weeks ago. You just didn't calculate it. Manual inventory management doesn't scale. "Reorder when it looks low" doesn't work when you have 50+ SKUs. You need a system. Reorder points are that system. They tell you exactly when to place your next order, automatically accounting for lead time, sales velocity, and demand variability. Let's build it in Excel.The Science of Reorder Points
A reorder point is the inventory level that triggers a new purchase order. Hit that level, order more. Simple. But calculating the right level requires understanding three components:1. Average Daily Sales Rate
How many units you sell per day on average. Formula: Total Units Sold ÷ Number of Days Example: 450 units sold in 90 days = 5 units/day2. Lead Time
Days from when you place an order until inventory arrives and is ready to sell. Includes: Order processing + manufacturing + shipping + receiving Example: 3 days to process + 12 days shipping + 2 days receiving = 17 days total lead time3. Safety Stock
Buffer inventory to protect against:- Demand spikes (suddenly selling 10 units/day instead of 5)
- Supply delays (shipment takes 20 days instead of 17)
- Seasonal variability
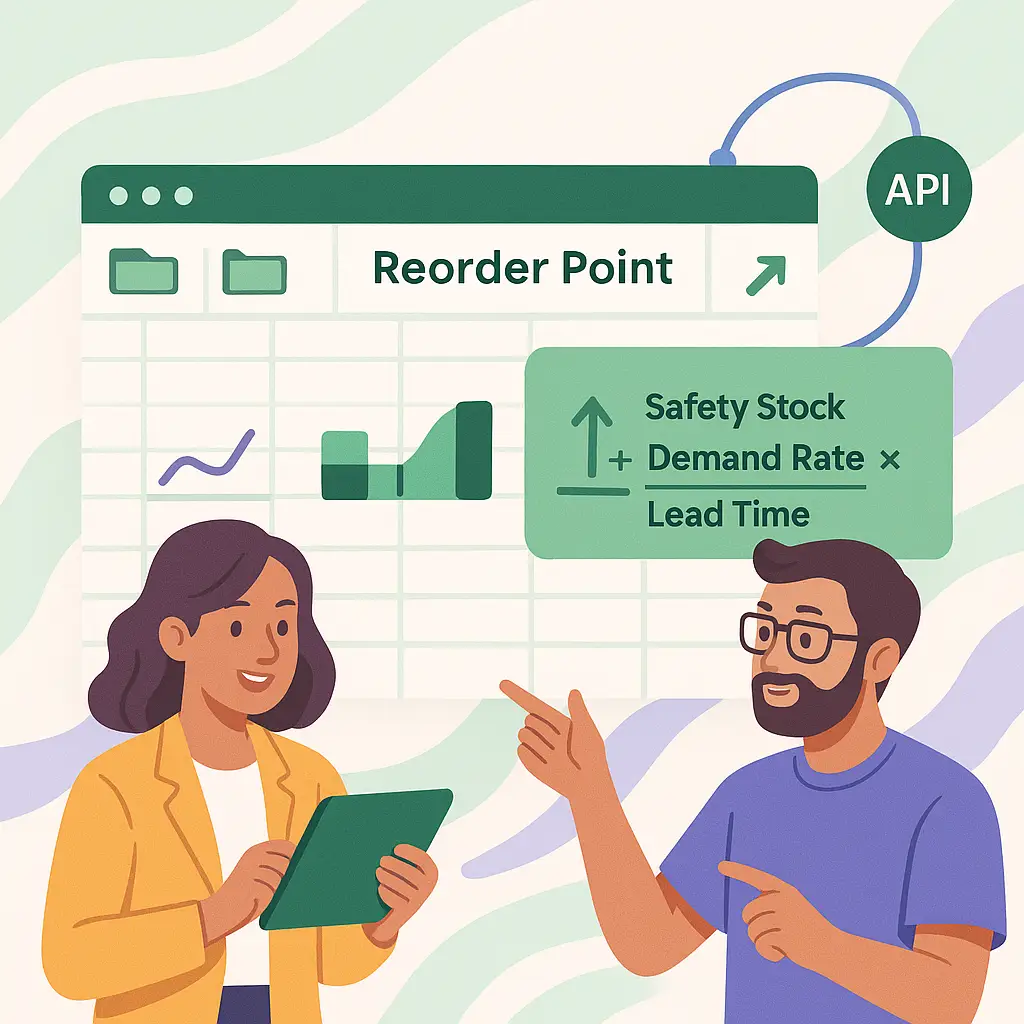
The Complete Reorder Point Formula
Reorder Point = (Average Daily Sales × Lead Time) + Safety Stock For our example:- Average Daily Sales: 5 units/day
- Lead Time: 17 days
- Safety Stock: 15 units (calculated)
Building Your Reorder Point Calculator in Excel
Create Your Product Master Table
Set up columns: SKU, Product Name, Current Stock, COGS, Supplier, Average Lead Time (days). This is your foundation. Export from Shopify or build manually.
Calculate Daily Sales Rate by SKU
Use last 90 days of sales data. Formula: =SUMIFS(units_sold, sku_column, this_sku, date_column, >=TODAY()-90) / 90. This gives you average daily sales rate.
Add Lead Time Data
Create a lead time column. If unknown, start with estimates: domestic suppliers 10-14 days, international 20-30 days. Track actual lead times from POs and update monthly.
Calculate Safety Stock (Simple Method)
Safety Stock = Daily Sales Rate × (Maximum Lead Time - Average Lead Time). If average is 17 days but max ever was 25 days, safety stock = 5 units/day × 8 days = 40 units.
Calculate Safety Stock (Statistical Method)
For variable demand: Safety Stock = 1.65 × STDEV(daily_sales_range) × SQRT(lead_time). The 1.65 factor gives 95% service level. Increase to 2.33 for 99% service level.
Calculate Final Reorder Point
Reorder Point = (Daily Sales Rate × Lead Time) + Safety Stock. Add a column: =B2*C2+D2. When Current Stock ≤ Reorder Point, trigger alert.
Add Conditional Formatting Alerts
Highlight cells where Current Stock < Reorder Point in red. Yellow when within 20% of reorder point. Green when well-stocked. This gives you at-a-glance inventory health.
Calculate Economic Order Quantity (EOQ)
EOQ determines how much to order. Formula: √((2 × Annual Demand × Order Cost) / Holding Cost per Unit). Balances ordering costs vs. storage costs. Order this amount when you hit reorder point.
Economic Order Quantity: How Much to Order
Knowing when to reorder is half the battle. The other half is knowing how much.The EOQ Formula
EOQ = √((2 × D × S) / H) Where:- D = Annual Demand (units per year)
- S = Cost per Order (shipping + admin + processing)
- H = Holding Cost per Unit per Year (storage + insurance + opportunity cost)
Real Example
Product: Coffee Mug- Annual Demand: 1,825 units (5/day × 365)
- Order Cost: $50 per shipment
- Holding Cost: $2 per unit per year (storage fees)
The Total Cost Check
With EOQ, you'll order about 6 times per year (1,825 / 302).- Ordering Costs: 6 orders × $50 = $300/year
- Holding Costs: (302/2) × $2 = $302/year
- Total: ~$600/year
- Ordering Costs: 37 × $50 = $1,850/year
- Holding Costs: (50/2) × $2 = $50/year
- Total: $1,900/year
| Sales Pattern | Safety Stock Multiplier | Service Level | Stockout Risk |
|---|---|---|---|
| Very Stable (<10% variance) | 1.0x daily sales | 90% | 1 in 10 cycles |
| Stable (10-20% variance) | 1.5x daily sales | 95% | 1 in 20 cycles |
| Moderate (20-30% variance) | 2.0x daily sales | 97% | 1 in 30 cycles |
| Variable (30-50% variance) | 2.5x daily sales | 99% | 1 in 100 cycles |
| Highly Variable (>50%) | 3.0x+ daily sales | 99.5% | Very rare |
Common Mistakes to Avoid
Verification Checklist
- Your reorder point for at least one SKU has prevented a stockout in the last 30 days
- You can explain why your reorder point is X units (daily sales × lead time + safety stock)
- Your EOQ calculation shows lower total cost than your current ordering pattern
- You've caught and fixed at least one product with incorrect reorder point
- You have conditional formatting showing reorder alerts automatically