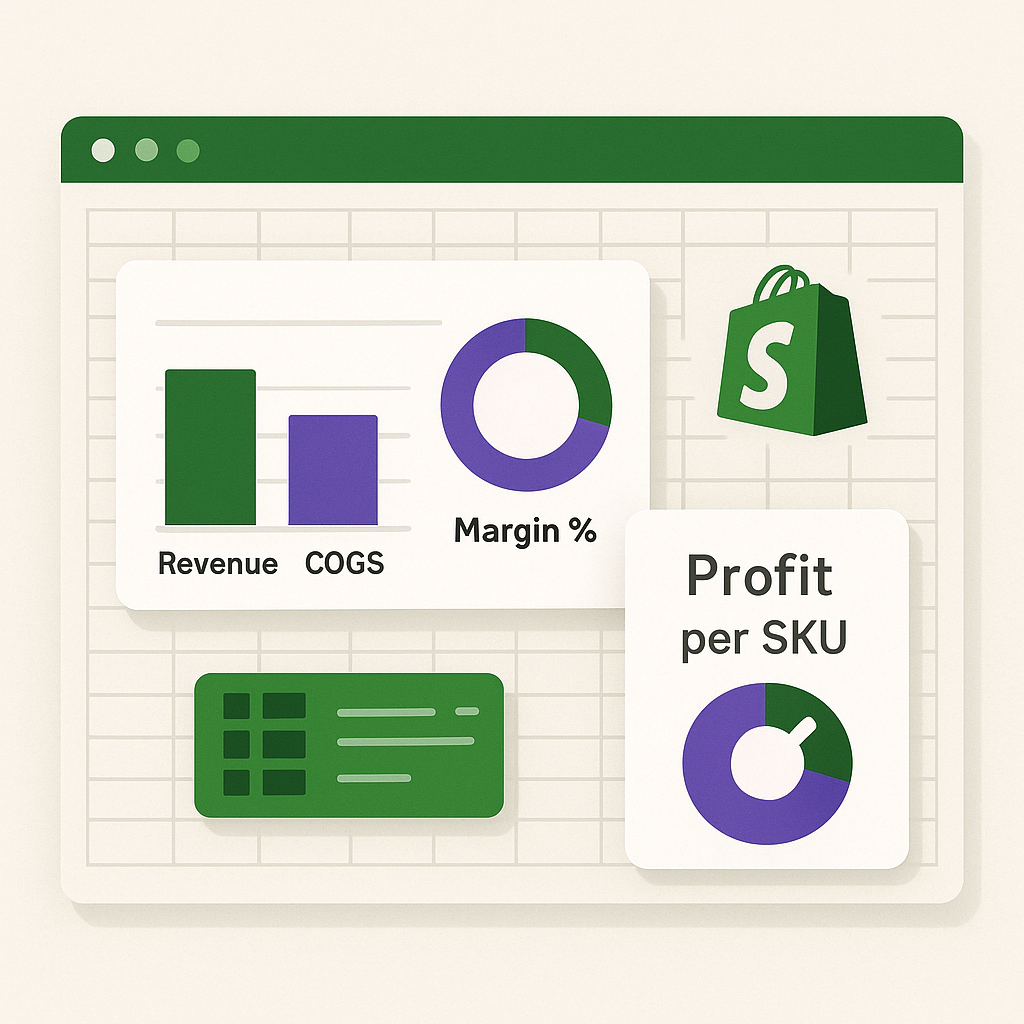
Margin Breakdown that shows true profit per SKU
Profit AnalysisSee real margin at SKU level. Full cost stack: COGS, fees, shipping. Find quick wins to fix or drop losers.
Your first run is free - no card required.
See real margin at SKU level. Full cost stack: COGS, fees, shipping. Find quick wins to fix or drop losers.
Your first run is free - no card required.
📍 Waterfall calculation engine complete, multi-currency support in testing
Get a ready-to-use file with everything you need

Revenue → COGS → fees → shipping → net profit per product
Payment, platform, transaction fees separated by type
Actual carrier cost vs. what customers paid
Raise prices, drop losers, renegotiate shipping
Platform-specific implementations of this decision kit with unique insights for each
Real outcomes for your business
Quick wins ready: Find 5-10 fixes worth $1,000-$3,000/month - raise prices, drop losers
True margin exposed: SKU-level breakdown with fees, shipping, COGS - no hidden costs
No more vanity: Replace revenue dashboards with honest profit metrics
Your top-selling SKUs might be losing money after all fees
You offer free shipping but don't know the true cost
You want to see every cost layer - COGS, fees, shipping - per product
From revenue to net profit, layer by layer
Definition: (Revenue - COGS - Payment Fees - Shipping Cost - Platform Fees) ÷ Revenue × 100
Source: Order revenue + itemized cost stack
Granularity: Per-SKU, per-category, per-platform
Definition: (Total Fees) ÷ Revenue × 100
Source: Payment gateway fees + platform commissions
Granularity: By platform, by product category
Definition: (Actual Shipping Cost - Customer Paid Shipping) ÷ Revenue × 100
Source: Carrier costs vs. shipping charged to customer
Granularity: Per-order, aggregated by zone/carrier
Unlock powerful insights with these automated features.
See every cost layer for each product: revenue → COGS → payment fees → shipping → net profit.
Compare margin performance across product categories and sales channels to optimize your mix.
Split fees into payment processing, platform commissions, and transaction fees - see where money leaks.
Auto-generated action list: raise prices, drop losers, renegotiate shipping, fix fee tiers.
Hours spent downloading CSVs, cleaning data, and formatting spreadsheets. Every week, every month, every platform.
3 simple steps to your first report
OAuth2 - no passwords
Select your date range
Ready in ~30 seconds
Upload a CSV mapping SKU to cost, or we can use category average margins. Missing COGS means we can only show gross margin, but still better than nothing.
Yes - we calculate shipping subsidy (actual carrier cost minus what customer paid, often $0). Shows the true cost of 'free shipping' promos.
We calculate fees based on your plan tier and payment gateway. Different rates for Stripe, PayPal, platform-native payments, etc.
Yes - if you sell on multiple platforms, we consolidate margin analysis and show which channels have better economics.
Start automating your e-commerce reporting today and save hours every week.
Our report recipes are designed by e-commerce experts who understand what metrics matter most for your business decisions.
Connect your platforms in minutes, not hours. Our OAuth2 integration makes setup secure and simple.
Reports are delivered in perfectly formatted Excel files that work seamlessly with your existing workflow.
Our report recipes are designed to provide actionable insights and recommendations for your business.
Start using Margin Breakdown (Fees - Shipping - COGS) today and turn your data into decisions
No card • Keep the file forever • Cancel anytime
