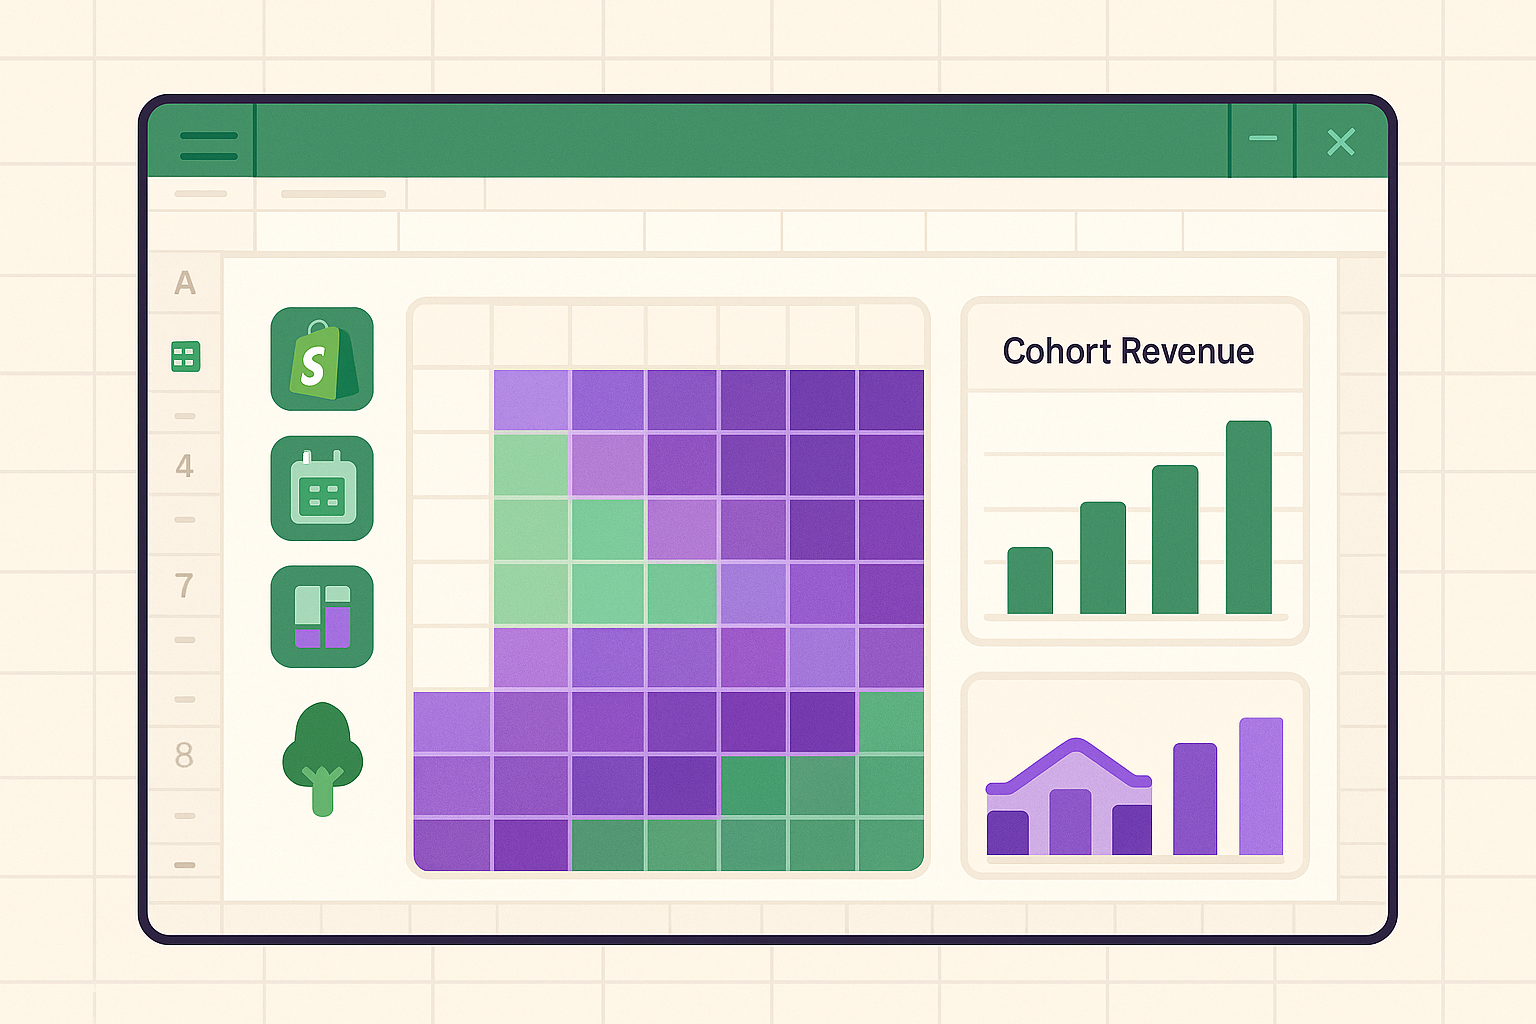
Dead Stock Analysis that unlocks cash from slow movers
Inventory ManagementSee exactly where cash is stuck. Get bundle ideas, markdown strategy, and channel recommendations. Turn dust into dollars.
Your first run is free - no card required.
See exactly where cash is stuck. Get bundle ideas, markdown strategy, and channel recommendations. Turn dust into dollars.
Your first run is free - no card required.

📍 Slow-mover detection complete, liquidation playbook in testing
Get a ready-to-use file with everything you need

SKUs by days since last sale and $ tied up
Cash recovery at 25%, 50%, 75% markdown levels
Pair dead SKUs with hot sellers based on order data
Which items to markdown on-site vs. liquidate on eBay
Platform-specific implementations of this decision kit with unique insights for each
Real outcomes for your business
Free cash fast: Unlock $5,000-$25,000 tied up in slow movers and dead inventory
Action plan ready: Bundle suggestions, markdown scenarios, and channel picks per SKU
Track progress: Weekly updates show dead stock $ decreasing - celebrate wins
You have products sitting on shelves for 90+ days with no sales
You need to free up cash to buy inventory that actually sells
You want a liquidation plan, not just a list of slow movers
From sales velocity to action plan
Definition: Sum of (Inventory × COGS) for SKUs with less than 1 sale per 90 days
Source: Inventory levels + sales velocity + cost data
Granularity: Total $ tied up, by SKU
Definition: SKUs with sales velocity less than 10% of category average
Source: Sales history by category
Granularity: Per-SKU, compared to category benchmark
Definition: (Cash recovered from markdown/bundle) ÷ COGS tied up × 100
Source: Projected recovery at discount levels
Granularity: Scenario analysis: 25%, 50%, 75% off
Unlock powerful insights with these automated features.
Rank SKUs by days since last sale and inventory value - see exactly where cash is stuck.
Get specific tactics: bundle with hot sellers, markdown %, best channels (eBay for liquidation, etc.).
Compare outcomes at 25%, 50%, 75% discounts - choose your strategy based on cash needs vs. margin.
Weekly reports showing dead stock $ decreasing as liquidation plans work - celebrate wins.
Hours spent downloading CSVs, cleaning data, and formatting spreadsheets. Every week, every month, every platform.
3 simple steps to your first report
OAuth2 - no passwords
Select your date range
Ready in ~30 seconds
We compare to the same period last year. Winter coats with no summer sales aren't flagged if they sold well last winter.
Items listed less than 90 days are excluded from dead stock analysis - they haven't had time to prove velocity yet.
We analyze which products are frequently bought together, then suggest pairing your dead SKUs with hot sellers.
We recommend eBay for truly dead items (6+ months no sale) and on-site markdowns for slower movers you want to clear at lower loss.
Start automating your e-commerce reporting today and save hours every week.
Our report recipes are designed by e-commerce experts who understand what metrics matter most for your business decisions.
Connect your platforms in minutes, not hours. Our OAuth2 integration makes setup secure and simple.
Reports are delivered in perfectly formatted Excel files that work seamlessly with your existing workflow.
Our report recipes are designed to provide actionable insights and recommendations for your business.
Start using Dead Stock Cleanup today and turn your data into decisions
No card • Keep the file forever • Cancel anytime