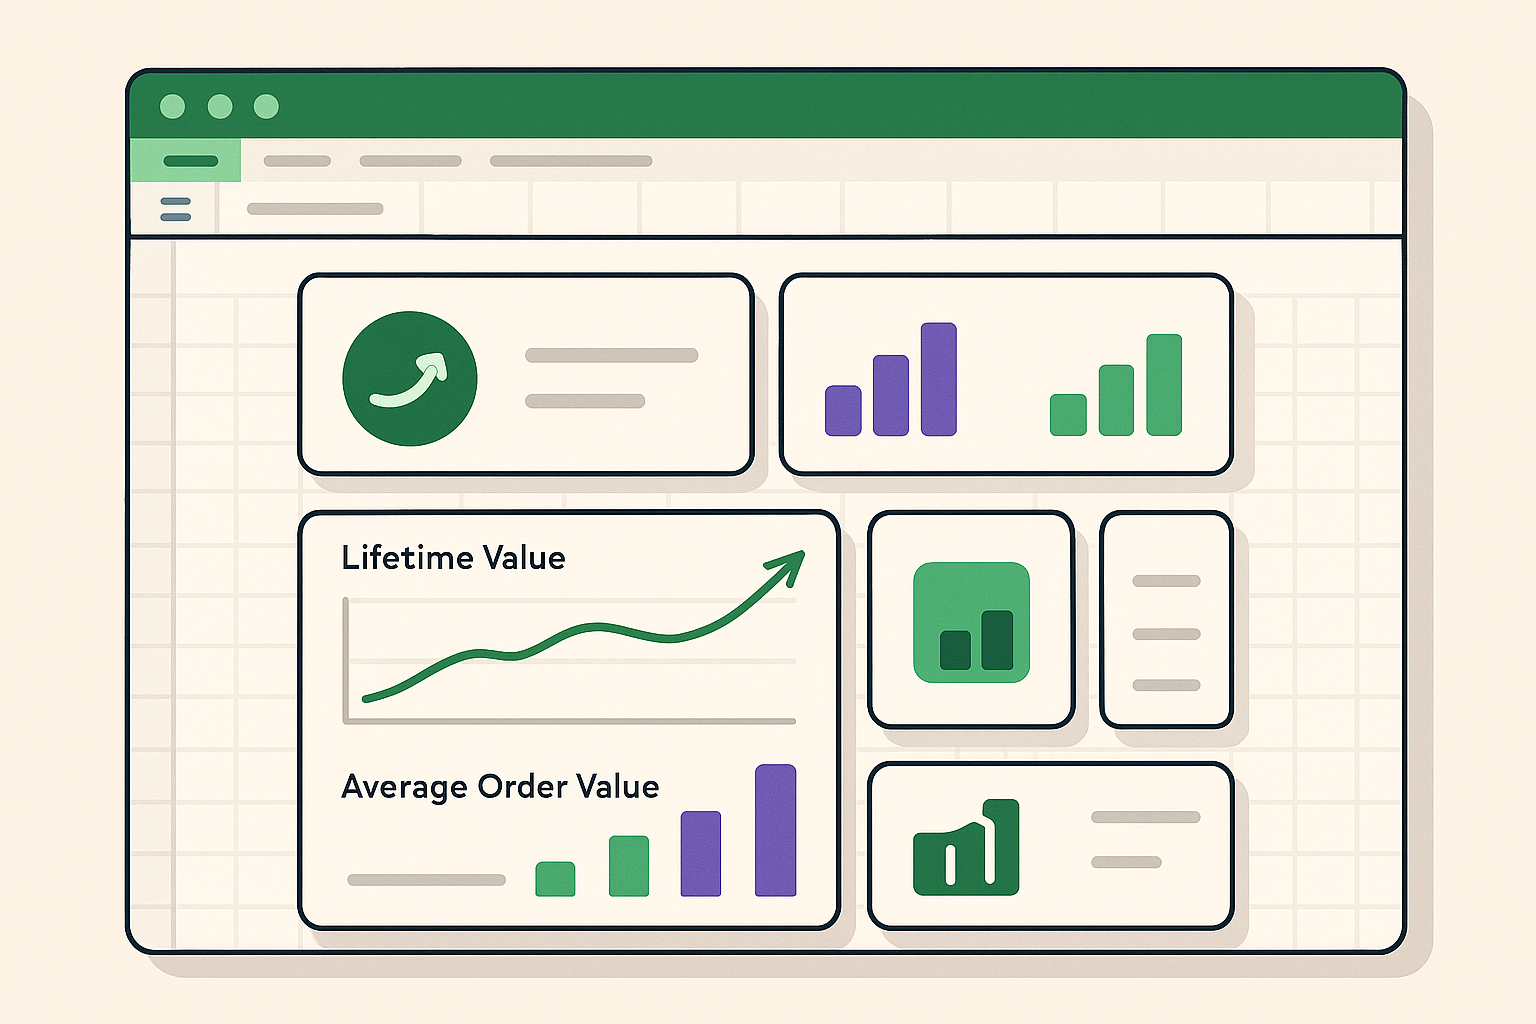
Customer LTV Analysis that finds your best customers
Growth & MarketingFind your top 10% VIP customers. See which channels bring repeaters vs. one-and-done buyers. Optimize spend for LTV, not first order.
Your first run is free - no card required.
Find your top 10% VIP customers. See which channels bring repeaters vs. one-and-done buyers. Optimize spend for LTV, not first order.
Your first run is free - no card required.

📍 Cohort grouping complete, channel attribution in testing
Get a ready-to-use file with everything you need

Month-by-month LTV and repeat rates by acquisition date
Top 10% customers by actual $ spent with contact info
Facebook vs. Google vs. organic - which bring loyal buyers
When customers make 2nd, 3rd, 4th purchases
Platform-specific implementations of this decision kit with unique insights for each
Real outcomes for your business
Know your VIPs: Top 10% of customers driving 60-80% of repeat revenue - treat them right
Channel payback: See how long until Facebook vs. Google customers pay back CAC
Smart budgets: Shift spend to channels that bring loyal buyers, not one-hit wonders
You want to know which customers are actually worth acquiring
You need to see if Facebook vs. Google customers repeat better
You want to optimize for LTV, not just first-order revenue
From first purchase to lifetime value, by acquisition source
Definition: (Total revenue from customer) ÷ (Time since first purchase) × expected lifespan
Source: Order history by customer
Granularity: Per-customer, averaged by cohort
Definition: (Customers with 2+ orders) ÷ (Total customers) × 100
Source: Order count per customer
Granularity: By cohort month, by channel
Definition: Months until cumulative LTV > estimated acquisition cost
Source: LTV curve by channel + CAC estimates
Granularity: Per-channel, by cohort
Unlock powerful insights with these automated features.
Month-by-month view: see which cohorts repeat best and drive highest LTV.
Ranked list of your best customers by LTV, with contact info for VIP treatment.
Compare Facebook vs. Google vs. organic vs. email - see which channels bring loyal customers.
Visual timeline showing when customers typically make their 2nd, 3rd, 4th purchases.
Hours spent downloading CSVs, cleaning data, and formatting spreadsheets. Every week, every month, every platform.
3 simple steps to your first report
OAuth2 - no passwords
Select your date range
Ready in ~30 seconds
We use your platform's basic attribution (like Shopify's referring_site). For better accuracy, you can import UTM parameters from Google Analytics.
Yes - we rank customers by net LTV (total spent minus refunds). You'll get a VIP list with contact info for special treatment.
Minimum 6 months, but 12+ months is better for seeing full repeat patterns. We'll work with what you have.
Yes - critical for accuracy. A customer who spent $500 but returned $300 shows as $200 LTV, not $500.
Start automating your e-commerce reporting today and save hours every week.
Our report recipes are designed by e-commerce experts who understand what metrics matter most for your business decisions.
Connect your platforms in minutes, not hours. Our OAuth2 integration makes setup secure and simple.
Reports are delivered in perfectly formatted Excel files that work seamlessly with your existing workflow.
Our report recipes are designed to provide actionable insights and recommendations for your business.
Start using Customer LTV & Cohorts today and turn your data into decisions
No card • Keep the file forever • Cancel anytime