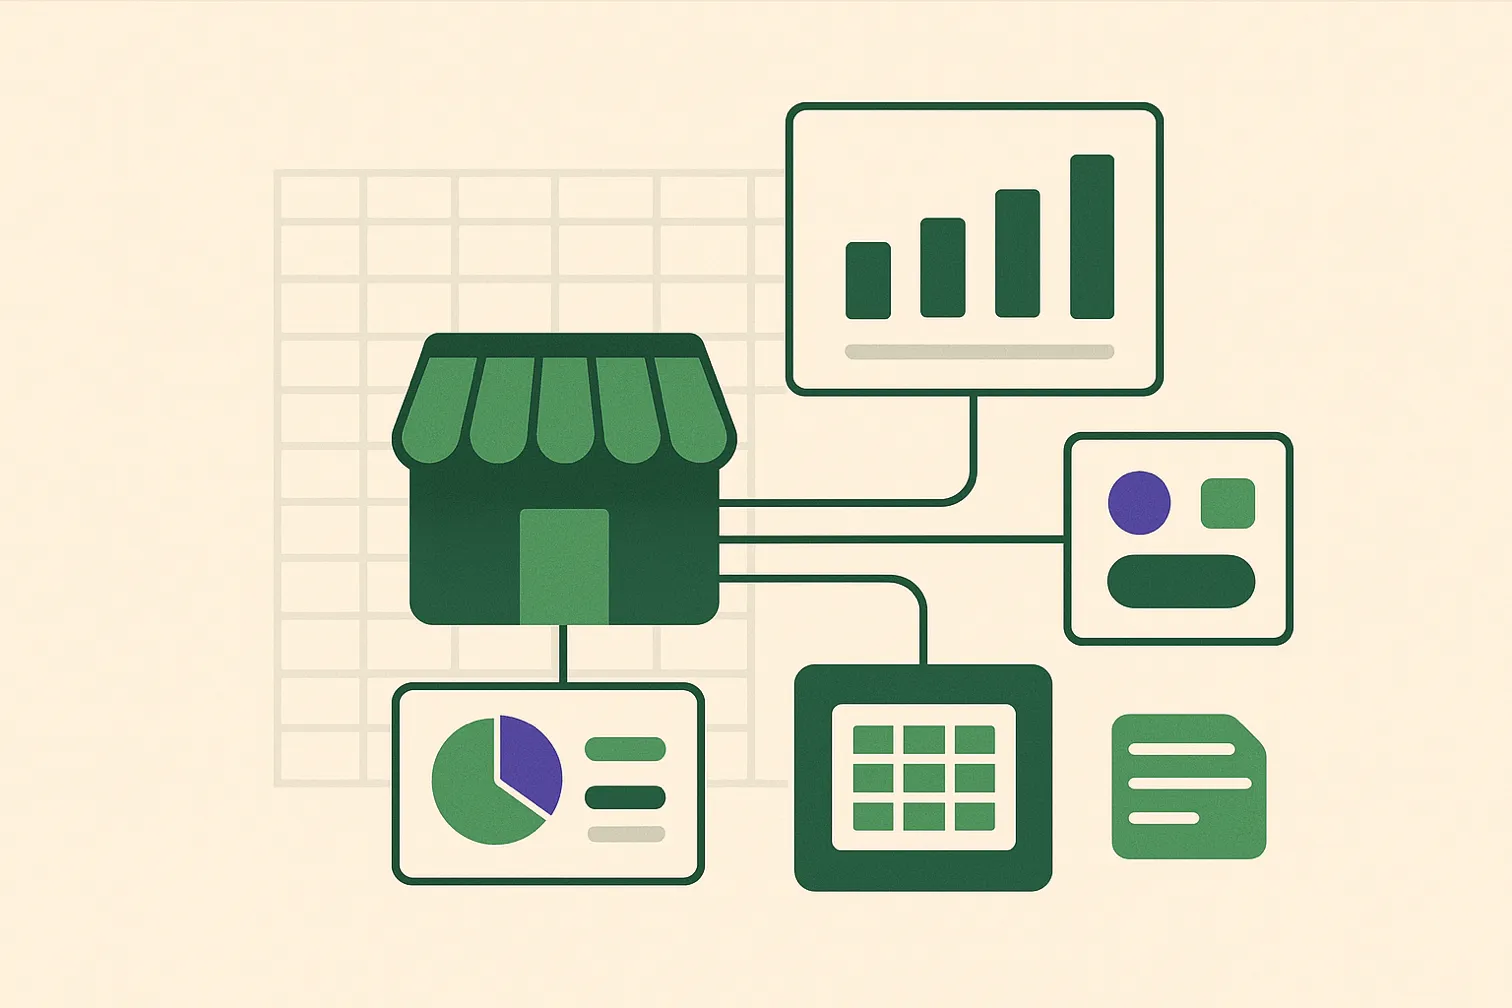
Your Shopify Dashboard is Just the Beginning
The Shopify dashboard is a great starting point for understanding your store's performance. But to uncover the deep insights that drive real growth, you need to go further. The standard dashboard can't easily answer questions like:
- Which products have the highest profit margins after accounting for fees?
- What is the lifetime value of customers acquired during a specific marketing campaign?
- How is my sales performance trending month-over-month, broken down by SKU?
To answer these questions, you need to get your data out of Shopify and into a spreadsheet. This guide will show you which reports are essential and how you can automate them.
5 Essential Shopify Sales Reports You Should Be Running
Here are five reports that will give you a comprehensive view of your business performance. All of these can be automated with Spreadsheet Broccoli's Shopify connector.
1. Daily/Weekly Sales Summary
What it is: A high-level overview of your key sales metrics: gross sales, net sales, discounts, shipping, taxes, and total sales.
Why it matters: It's the daily pulse of your business. Automating this report saves you from having to check the dashboard constantly and allows you to build a historical trend analysis over time.
2. Sales by Product (Product Performance)
What it is: A detailed breakdown of sales performance for each product or variant. Key metrics include units sold, gross sales, discounts applied, and net sales per SKU.
Why it matters: This report helps you identify your best-selling products, slow-moving inventory, and the real-world impact of your discount strategies on a per-product basis.

3. Sales by Discount Code
What it is: A report that shows how many times each discount code was used and the total sales amount associated with it.
Why it matters: It's the only way to accurately measure the ROI of your promotional campaigns. See which offers are driving sales and which are being ignored by your customers.
4. Customer Lifetime Value (CLV)
What it is: A report that segments your customers and calculates their total spending over time. You can segment by acquisition source, first product purchased, and more.
Why it matters: CLV is one of the most important metrics for sustainable growth. It tells you which marketing channels are bringing in the most valuable customers, allowing you to focus your ad spend effectively.
5. Payout Reconciliation Report
What it is: A detailed report that matches every Shopify payout to the specific orders, refunds, and fees included in it.
Why it matters: This is crucial for accurate accounting. It bridges the gap between your gross sales and the actual cash that hits your bank account.
Ready to automate your Shopify reporting and unlock deeper insights?
Connect Your Shopify StoreHow to Automate These Reports
Setting this up with Spreadsheet Broccoli is a simple, three-step process:
1. Connect your Shopify store: Securely authorize your account in just a few clicks.
2. Choose a recipe: Select one of our pre-built Shopify report recipes, like "Product Performance Analysis" or "Sales Summary".
3. Schedule it: Choose how often you want the report to run (e.g., daily, weekly) and whether you want it in Excel.
Once configured, the reports will be automatically generated and delivered to your dashboard, giving you a consistent, reliable source of truth for your business performance.
Common Mistakes to Avoid
Learn from these common pitfalls to ensure success
Relying only on Shopify's dashboard for business decisions
Solution: Export to Excel for trend analysis, SKU-level calculations, and custom metrics that dashboard doesn't show.
Not tracking profit after fees at the SKU level
Solution: Your best-selling product might be losing money after Shopify fees, payment fees, and discounts. Track net profit per SKU.
Comparing gross sales instead of net sales period-over-period
Solution: Heavy discounting can inflate gross sales while killing profit. Always compare net sales and margins.
How to Verify Your Numbers
Ensure accuracy with these verification steps
Your report totals match Shopify dashboard for the same date range
You can identify your top 10 SKUs by net profit (not just revenue)
You know which discount codes are profitable vs. money-losing
You can calculate true customer lifetime value segmented by acquisition source
Frequently Asked Questions
Can I see historical trends going back years?
Will this work if I have thousands of orders per month?
Can I customize reports for my specific business needs?
Ready to Transform Your Reporting?
Start with a free report and see exactly what you'll get every time.
