
Introduction: Your First Step to Automated Reporting
Tired of spending hours manually exporting CSVs, copying and pasting data, and building the same reports over and over? You're in the right place. Spreadsheet Broccoli is designed to eliminate this tedious work, giving you back time to focus on what the data actually means.
This guide will walk you through the simple process of creating your very first automated report. In just a few minutes, you'll see how easy it is to connect your business platforms and get analysis-ready data delivered directly to your spreadsheet.
What You'll Need (Prerequisites)
Before we dive in, let's make sure you have everything you need. It's a short list!
1. A Spreadsheet Broccoli Account: If you haven't signed up yet, you can create a free account to get started.
2. Access to a Spreadsheet Tool: Our platform works seamlessly with both Microsoft Excel.
3. An Account with a Supported Platform: You'll need credentials for at least one of our supported platforms, like Shopify, Amazon, Stripe, or WooCommerce. This is where we'll pull your data from.
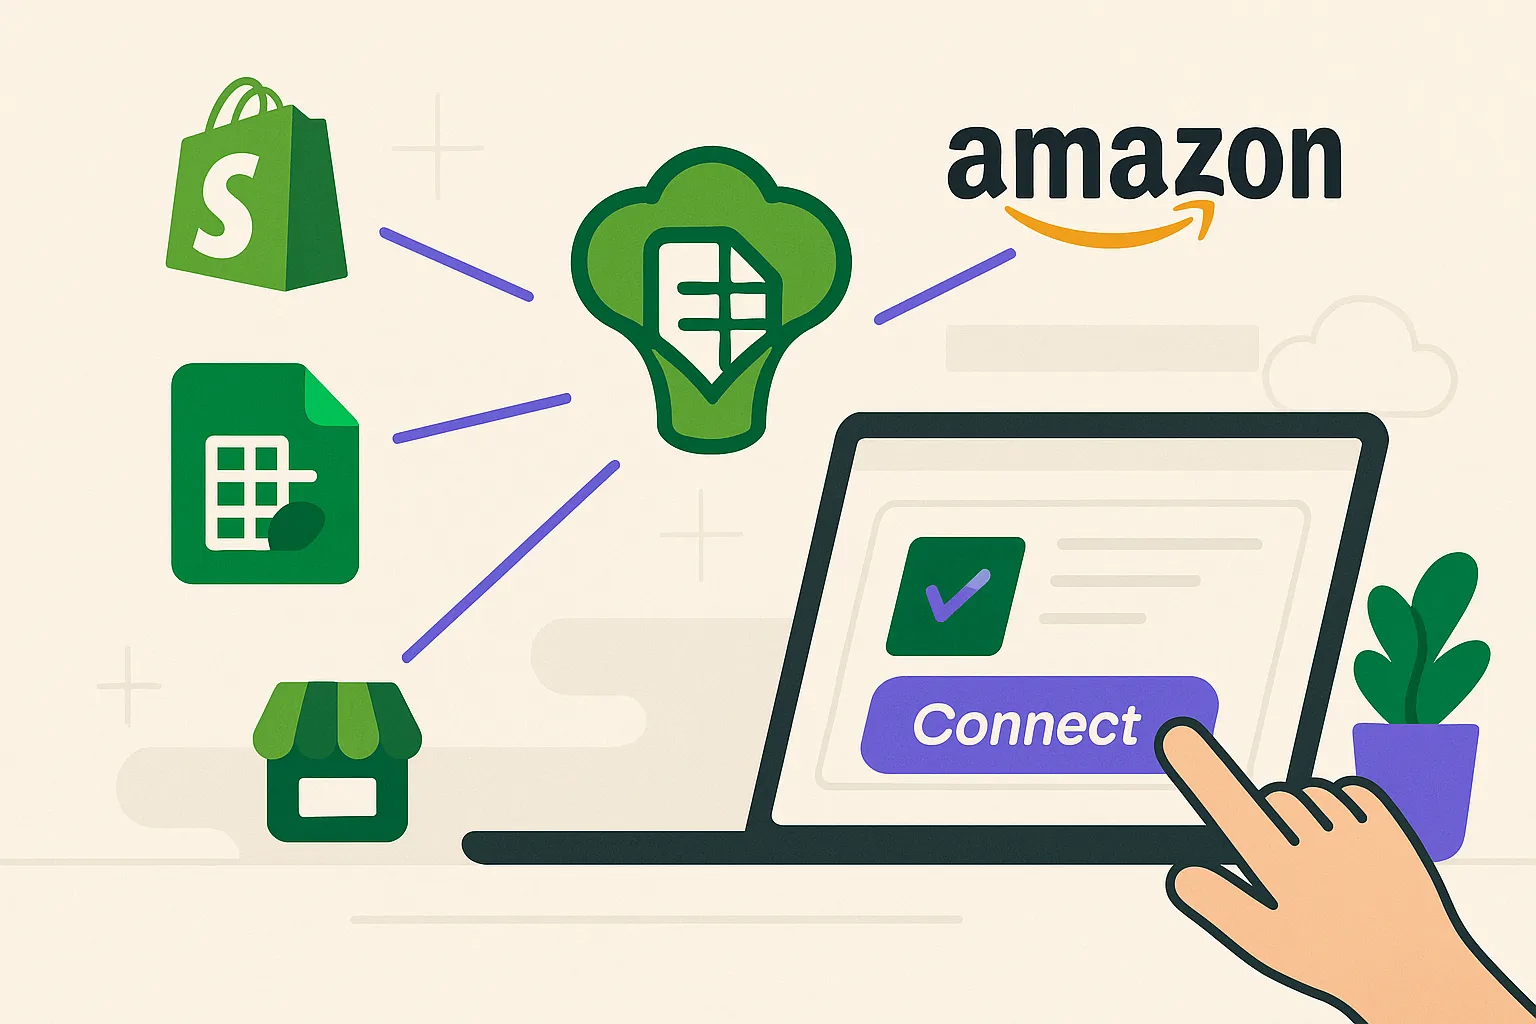
Step 1: Securely Connect Your Data Source
The foundation of any report is the data. Your first step is to tell Spreadsheet Broccoli where to get it. We use secure, official connections (like OAuth2) to link to your accounts, so your credentials are never stored by us and your data remains safe.
- Navigate to the "Connectors" section in your dashboard.
- Find the platform you want to use (e.g., Shopify) and click "Connect".
- You'll be prompted to log in to that platform and authorize Spreadsheet Broccoli to access your data. This is a standard, secure process that grants us read-only access.
That's it! Your data source is now connected and ready to go. Now for the fun part. Instead of building reports from scratch, you'll use one of our "Report Recipes." Think of these as powerful, pre-built templates designed by data experts for common business needs. We have a growing library of recipes, including: Browse the recipe library, find one that matches your goal, and click "Use Recipe". Here's where you tailor the recipe to your exact needs. The options will vary depending on the recipe, but you can typically configure: - Date Ranges: Choose a specific period like "Last 90 Days" or "All Time". This flexibility ensures you get precisely the data you need, formatted correctly, without any extra manual work. Once you're happy with your configuration, you have two options: 1. Generate Now: Click the "Generate" button for a one-time report. For your first report, let's click "Generate." We'll process your data, which may take a few moments depending on the volume. You'll receive a notification when it's ready to download. Ready to say goodbye to manual reporting? Start your free trial. Congratulations! You've successfully created your first automated report. You've connected a data source, chosen a template, and generated a clean, analysis-ready spreadsheet. From here, you can explore more recipes, connect other platforms, and set up schedules to put your reporting on autopilot. Welcome to a more efficient way of working with data.
Step 2: Choose a Report Recipe
- Financial Reports: Payout Reconciliation, Sales Tax Summaries.
- Sales & Marketing Analysis: Product Performance, Marketing Campaign ROI.
- Customer Insights: Customer Segmentation, Lifetime Value Analysis.
Step 3: Configure and Customize Your Report
- Filters: Narrow down the data. For a sales report, you might filter by a specific product SKU or sales channel.
- Output Columns: Select the exact data fields you want in your final spreadsheet.
Step 4: Generate and Schedule
2. Set a Schedule: This is where the real magic happens. You can schedule the report to run automatically - daily, weekly, or monthly. Set it up once, and Spreadsheet Broccoli will deliver updated reports to your dashboard on schedule.
Conclusion: You're Just Getting Started!