
The Small Business Data Dilemma
As a small business owner, you're flooded with data from your sales platforms, marketing tools, and payment processors. You know there are valuable insights hidden in there, but who has the time to find them? It's easy to get stuck in a cycle of collecting data but never actually *using* it to make better decisions.
The key isn't more data; it's a better framework for thinking about it. Here is a simple, three-step framework - Automate, Analyze, Act - to help you turn your data into your most powerful asset. The Goal: Stop wasting time on manual data work. Before you can analyze anything, you need reliable, consistently formatted data. This is the most critical and often most time-consuming step. Manually exporting CSVs every week is not a scalable strategy. It's tedious, boring, and prone to human error. This is the problem Spreadsheet Broccoli was built to solve. By connecting your platforms and using our report recipes, you completely automate this first step. You set it up once, and a clean, analysis-ready spreadsheet arrives on schedule, every time. Action Item: Connect your primary sales channel (e.g., Shopify) and automate at least one core report, like a daily sales summary. The Goal: Find the "so what?" in your data. With your data collection on autopilot, you can now invest your time in analysis. This doesn't require a data science degree. It simply requires asking good questions. Look at your automated report and ask: - What is surprising? (e.g., "Wow, that one product is responsible for 40% of our sales.") Schedule just 30 minutes on your calendar each week for "Data Analysis." Open your automated report and focus only on finding one or two key insights. The Goal: Turn your insight into a concrete business action. An insight is useless until you do something with it. This is the step that separates successful data-driven businesses from those that just look at data. The "Act" step should be a specific, measurable action. - Insight: "Our new marketing campaign is driving a lot of traffic, but the conversion rate is low." - Insight: "Our top-selling product is frequently out of stock." Ready to build your own data-driven decision framework? Start by automating the first step. By following the Automate, Analyze, Act framework, you create a virtuous cycle. Automation frees up time for analysis. Analysis leads to actionable insights. Actions lead to business improvements, which generates new data, and the cycle continues. Start small. Automate one report. Find one insight. Make one decision. This is how you build a smarter, more resilient business, one data point at a time.
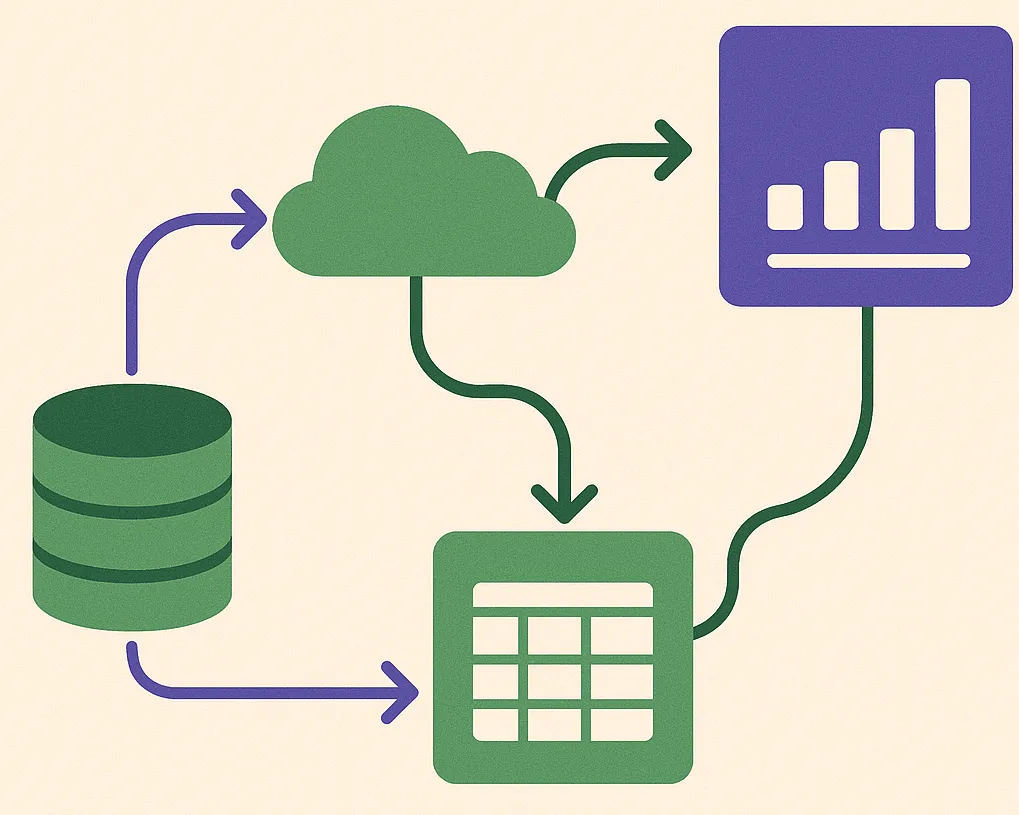
Step 1: Automate Data Collection & Reporting
Step 2: Analyze for Insights (Ask the Right Questions)
- What is trending up or down? (e.g., "Our average order value has been decreasing for the past three weeks.")
- How does this compare to last month/year? (e.g., "Our sales are up 15% year-over-year, but our profit margin is down.")
Step 3: Act on Your Insights
- Action: A/B test a new landing page with a clearer call-to-action for that campaign.
- Action: Increase the next purchase order for that product by 25% and set a lower re-order threshold.
Track the results of your actions. Did the new landing page improve conversions? Did the larger purchase order prevent stockouts? This closes the loop and starts the cycle over again with new data.
Conclusion: A Virtuous Cycle